 Help DocsAgency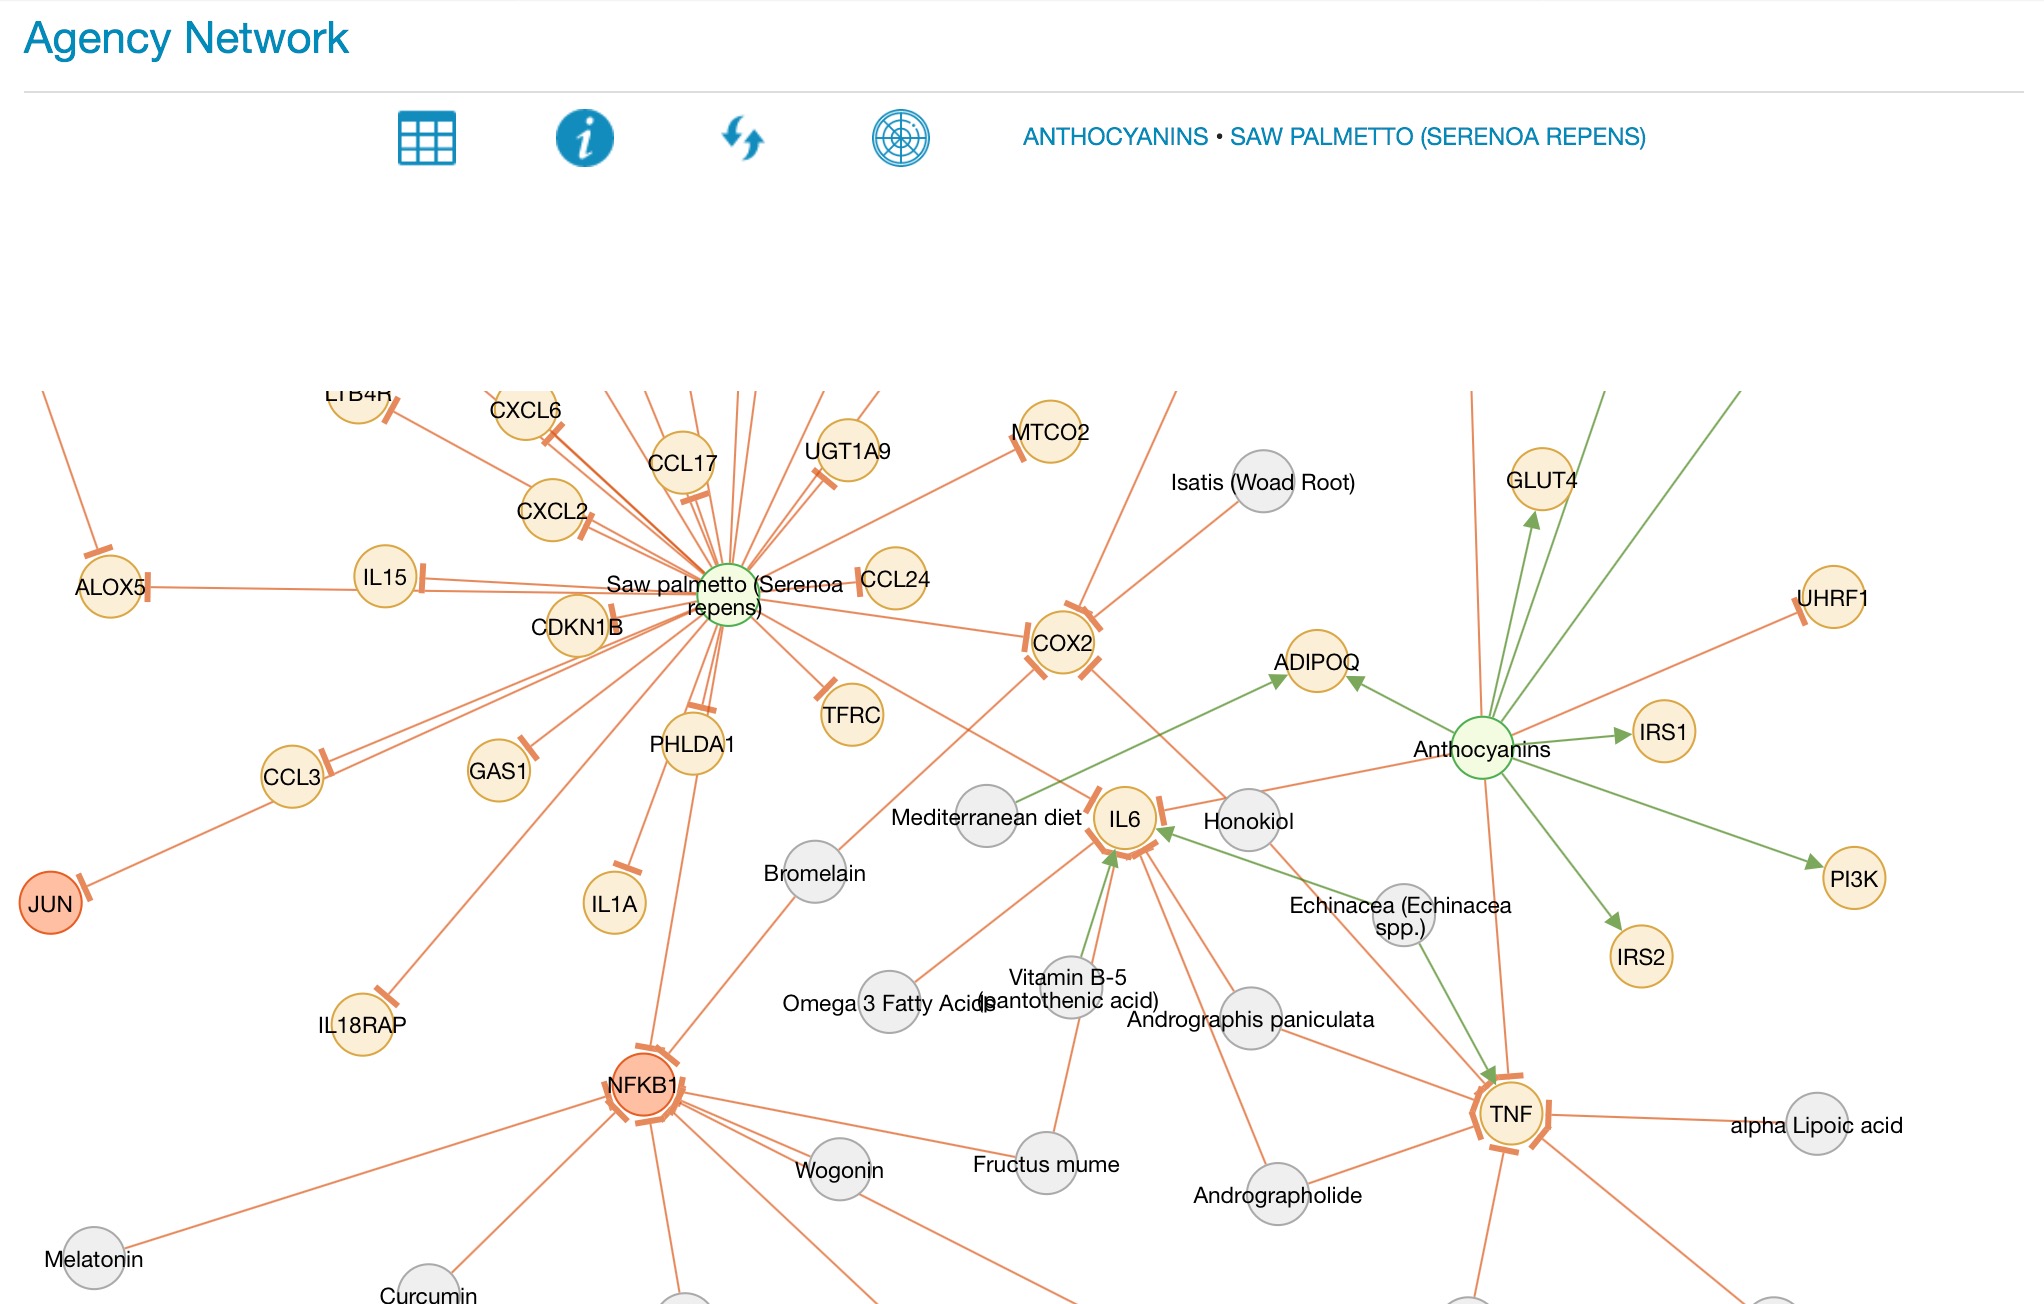
AGENCY is the portal to the Opus23 Pro gene-agent visualizer network map. This tool may be useful when selecting appropriate agents for modifying the expression of the client's target genes or related genetic pathways, as well as for identifying the effects of neighboring agents. If the gene of interest is associated with agents in the database, AGENCY will show you which other genes are influenced by the selected agent and which other agents interact with the target gene. Getting around AGENCY From the 'Informatics' link on the main menu, hover over 'Prescriptives' until a second menu list appears, then select AGENCY. You will be presented with the AGENCY screen: 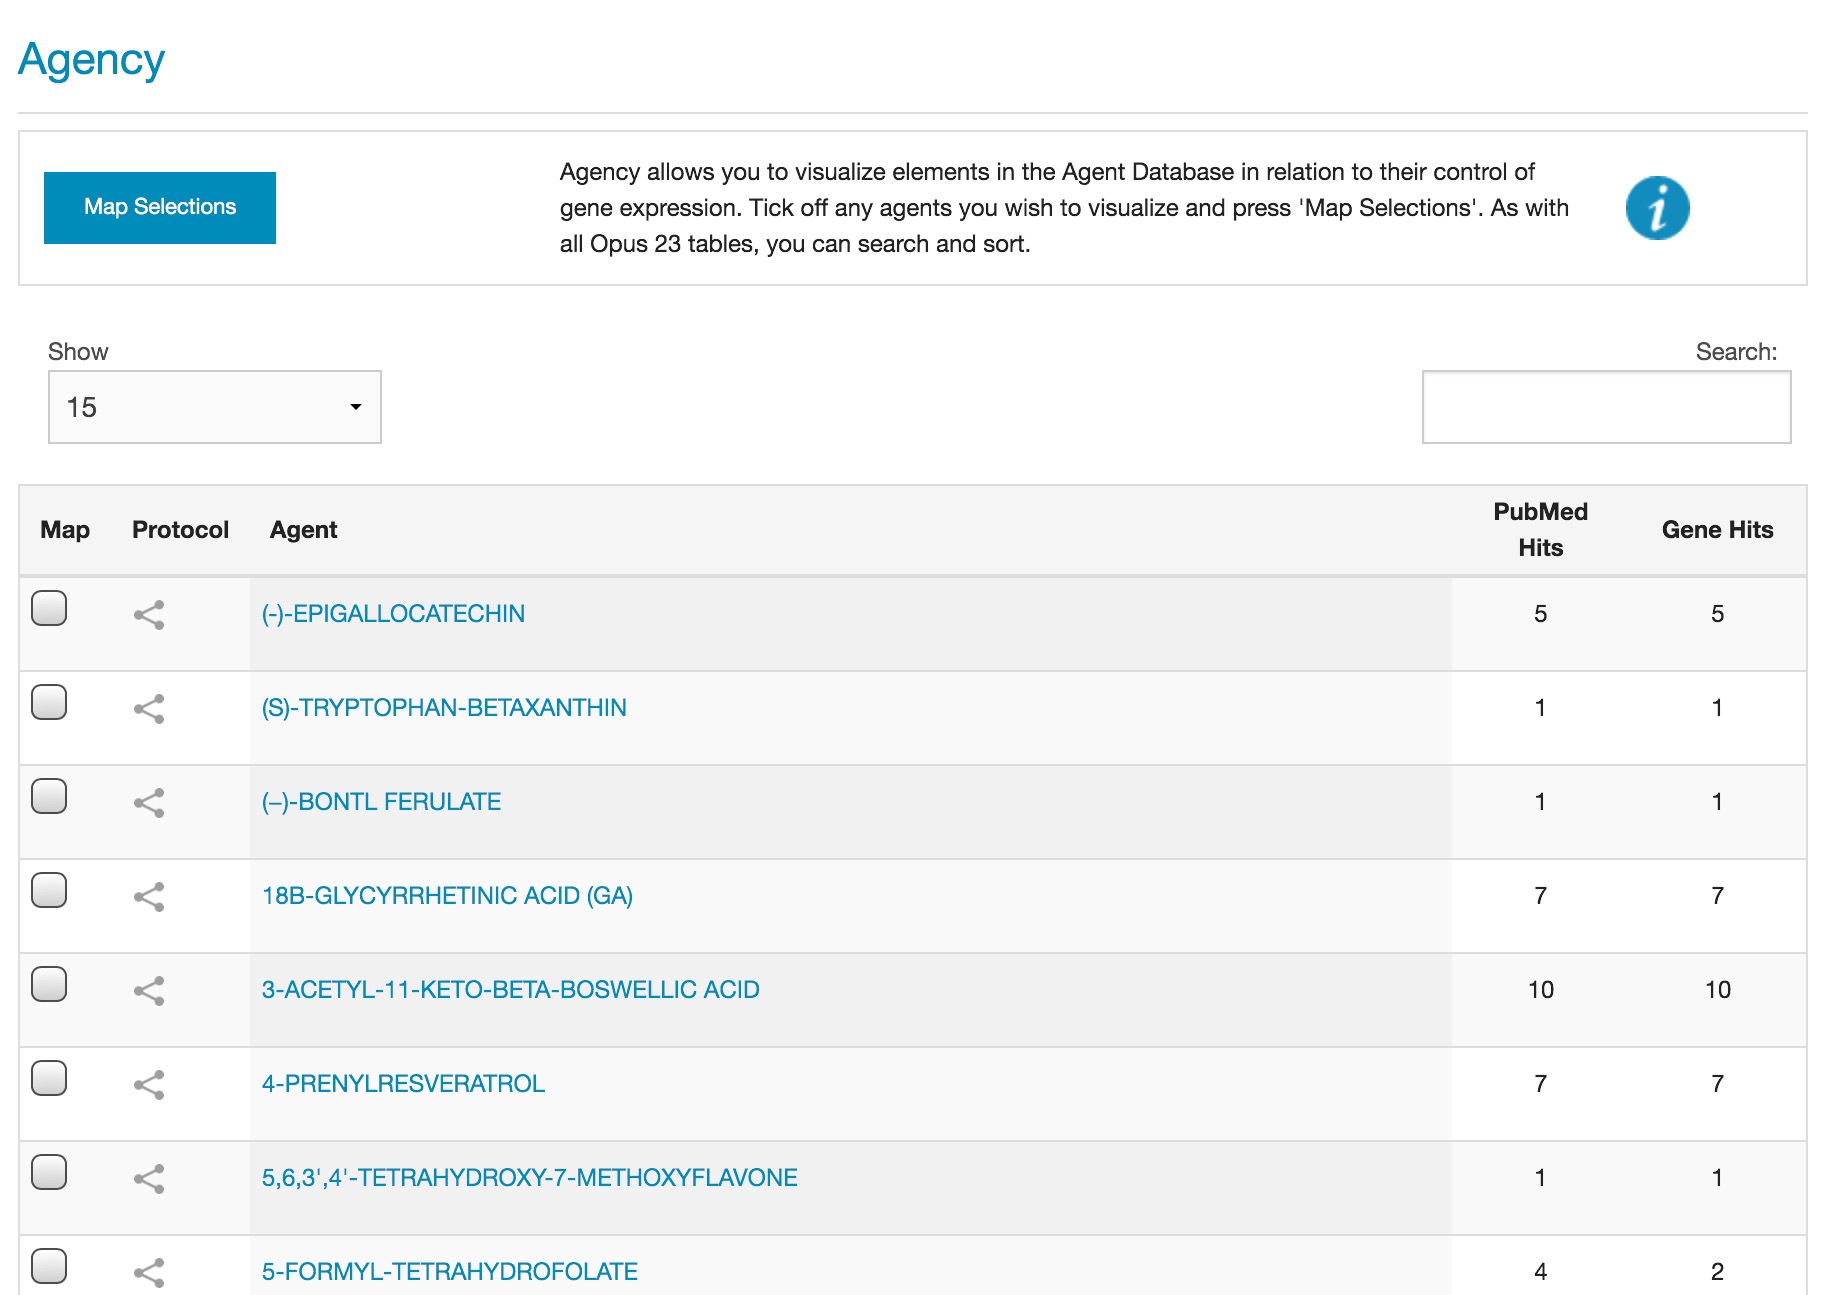
AGENCY data screen The AGENCY screen can be sorted by the Agent column, the PubMed Hits column or the Gene Hits column, just click on the column heading to sort, and click on the same column heading again to reverse the sort order. The default view sorts the columns by agent. Change the number of rows visible in AGENCY by clicking on the drop-down 'Show' menu and selecting the number of rows to display. Search for any text in the Agent column by typing in the search box. Some agents may have an effect on multiple genes, and some agents have entries in multiple PubMed articles, the number of article and gene hits for each agent can be seen in the relevant column. Clicking on an agent opens a pop-up for that agent. Using the AGENCY visualizer AGENCY visualizer showing the network map for licorice The visualizer in AGENCY is a powerful graphic representation of the potential interaction between multiple agents and genes. AGENCY can be used to display the network map of a single agent with its gene connections, or the interaction between multiple agents. Select one or more agents by ticking the Map checkbox and then press 'Map selections'. A network map will open displaying the interactome for the selected agents. The elements are color-coded as follows: Agents selected in the AGENCY data screen are in a green circle.
Use the mouse scroller to zoom. Grab and hold the canvas to move it, and grab any individual node to move it around the canvas. Click on any node to trigger an information pop-up. Pressing the 'i' button brings up a pop-up window with a key to the color codes on the map. Agents can be added to the current client protocol dataset by clicking on the protocol icon in the AGENCY data screen, or from the agent pop-up. The selected agents can be viewed and further edited in the Protocol Dataset, accessible from the Client Report Routing screen under the Curation menu. 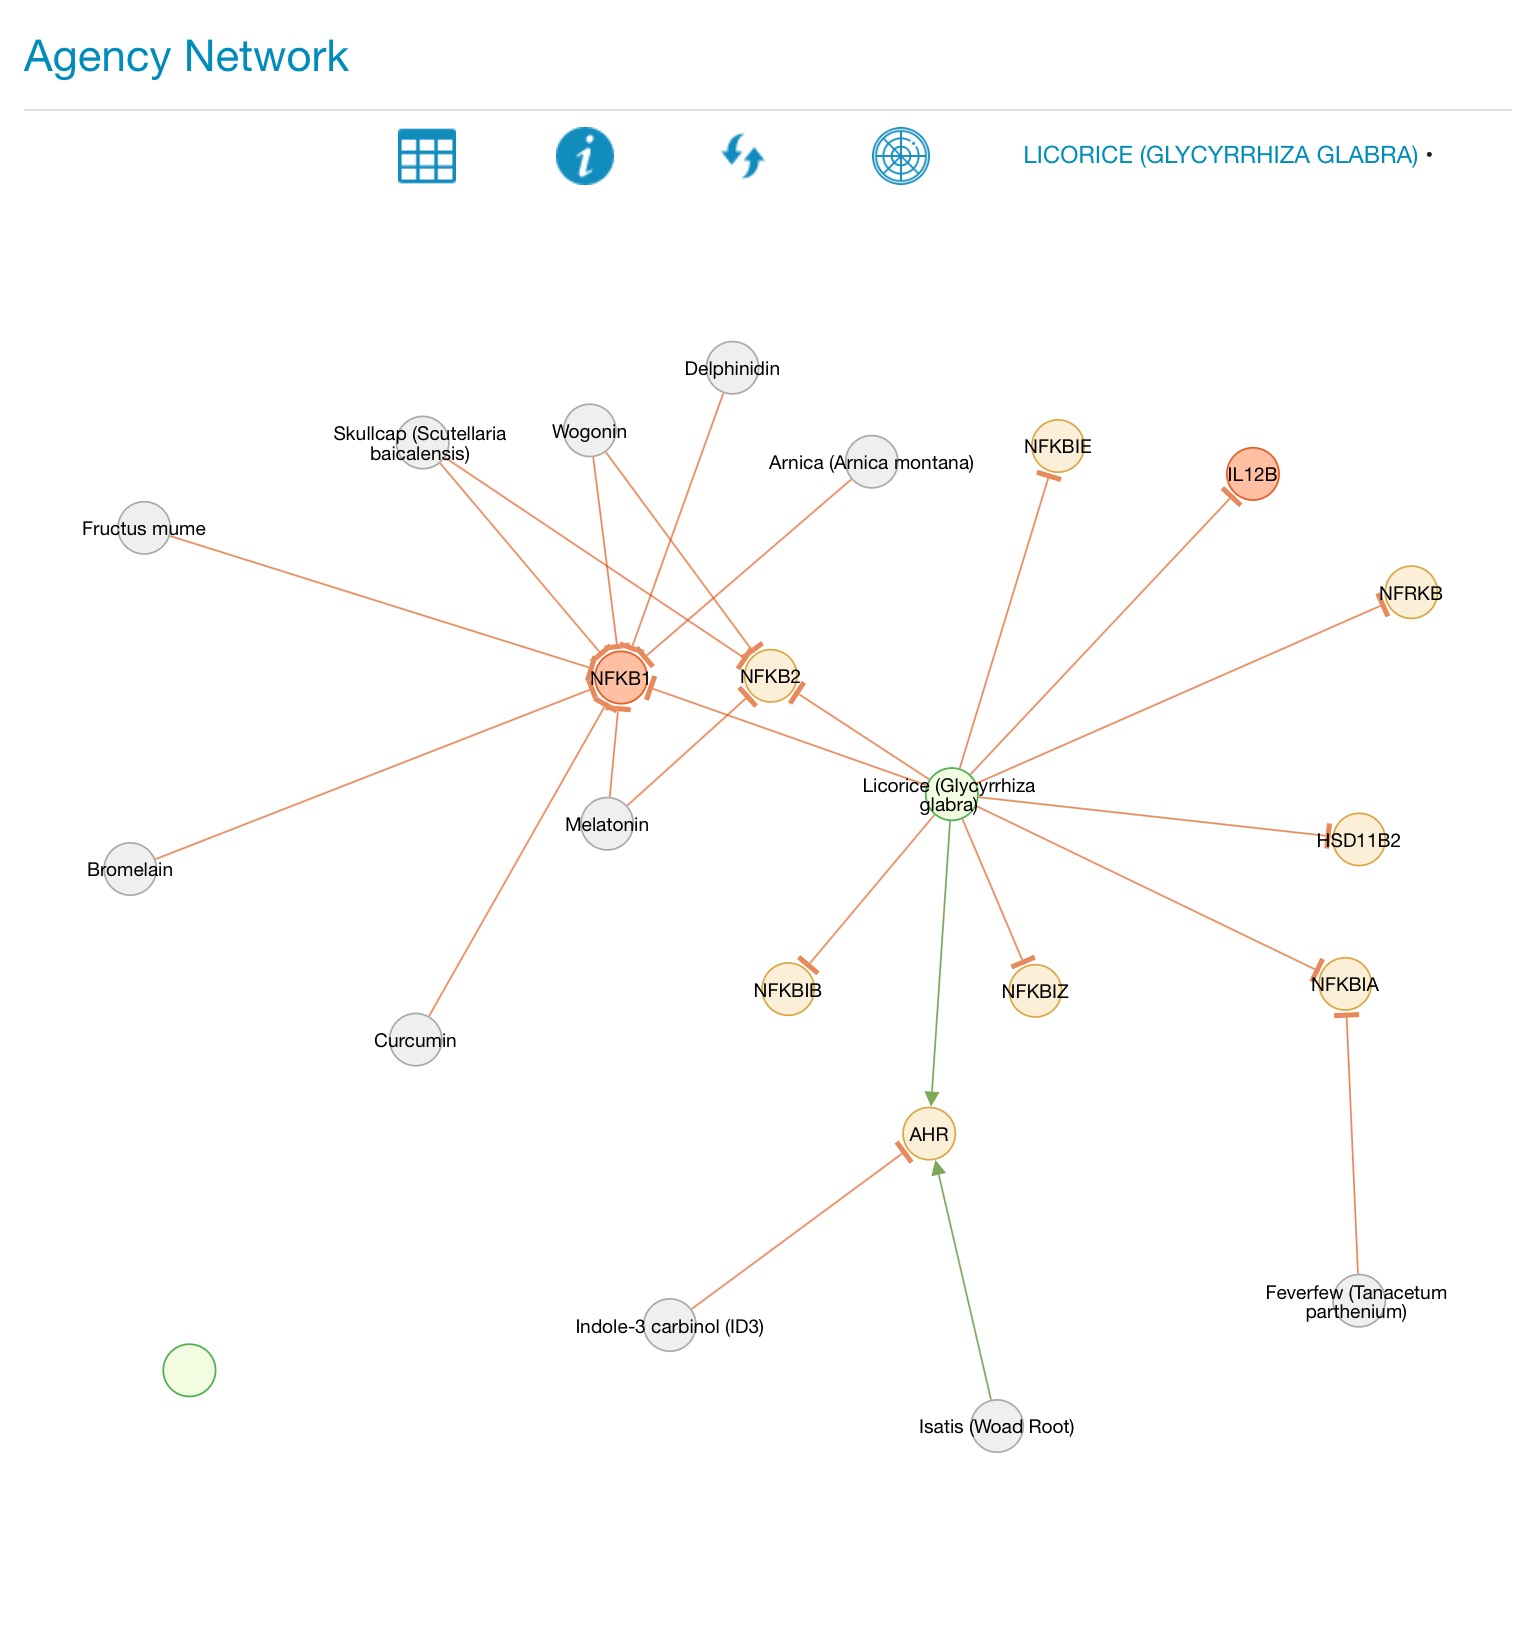
AGENCY visualizer showing the interactome network map for two agents Clicking on the name of each agent switches from the network map to a genomic expression fingerprint of the selected agent, and the circle icon displays a single combined genomic expression map for all agents selected. Clicking on the circular arrows icon reloads the network map. The grid icon returns to the AGENCY data screen. In addition to its network (web) depiction, any natural product can have its gene expression data depicted as a polar chart. 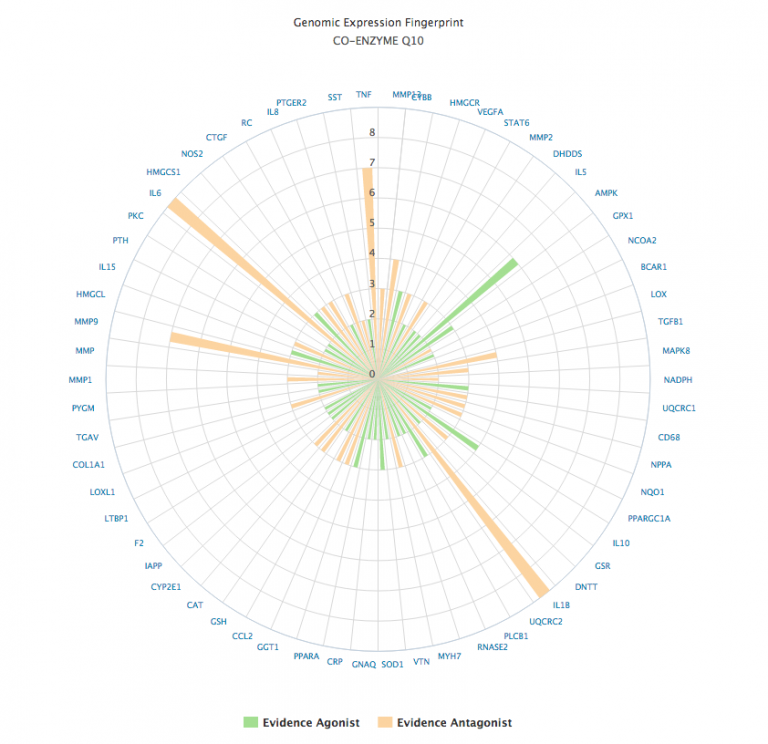
The polar chart format display the gene expression data as orange if the evidence is suggestive of an antagonistic effect, or green if the effect is agonistic. The strength of the evidence is computed from the sum total of the evidence, scaled by the type of experimental subject (in vitro, animal or human study). |
